SQL Flow Visualization
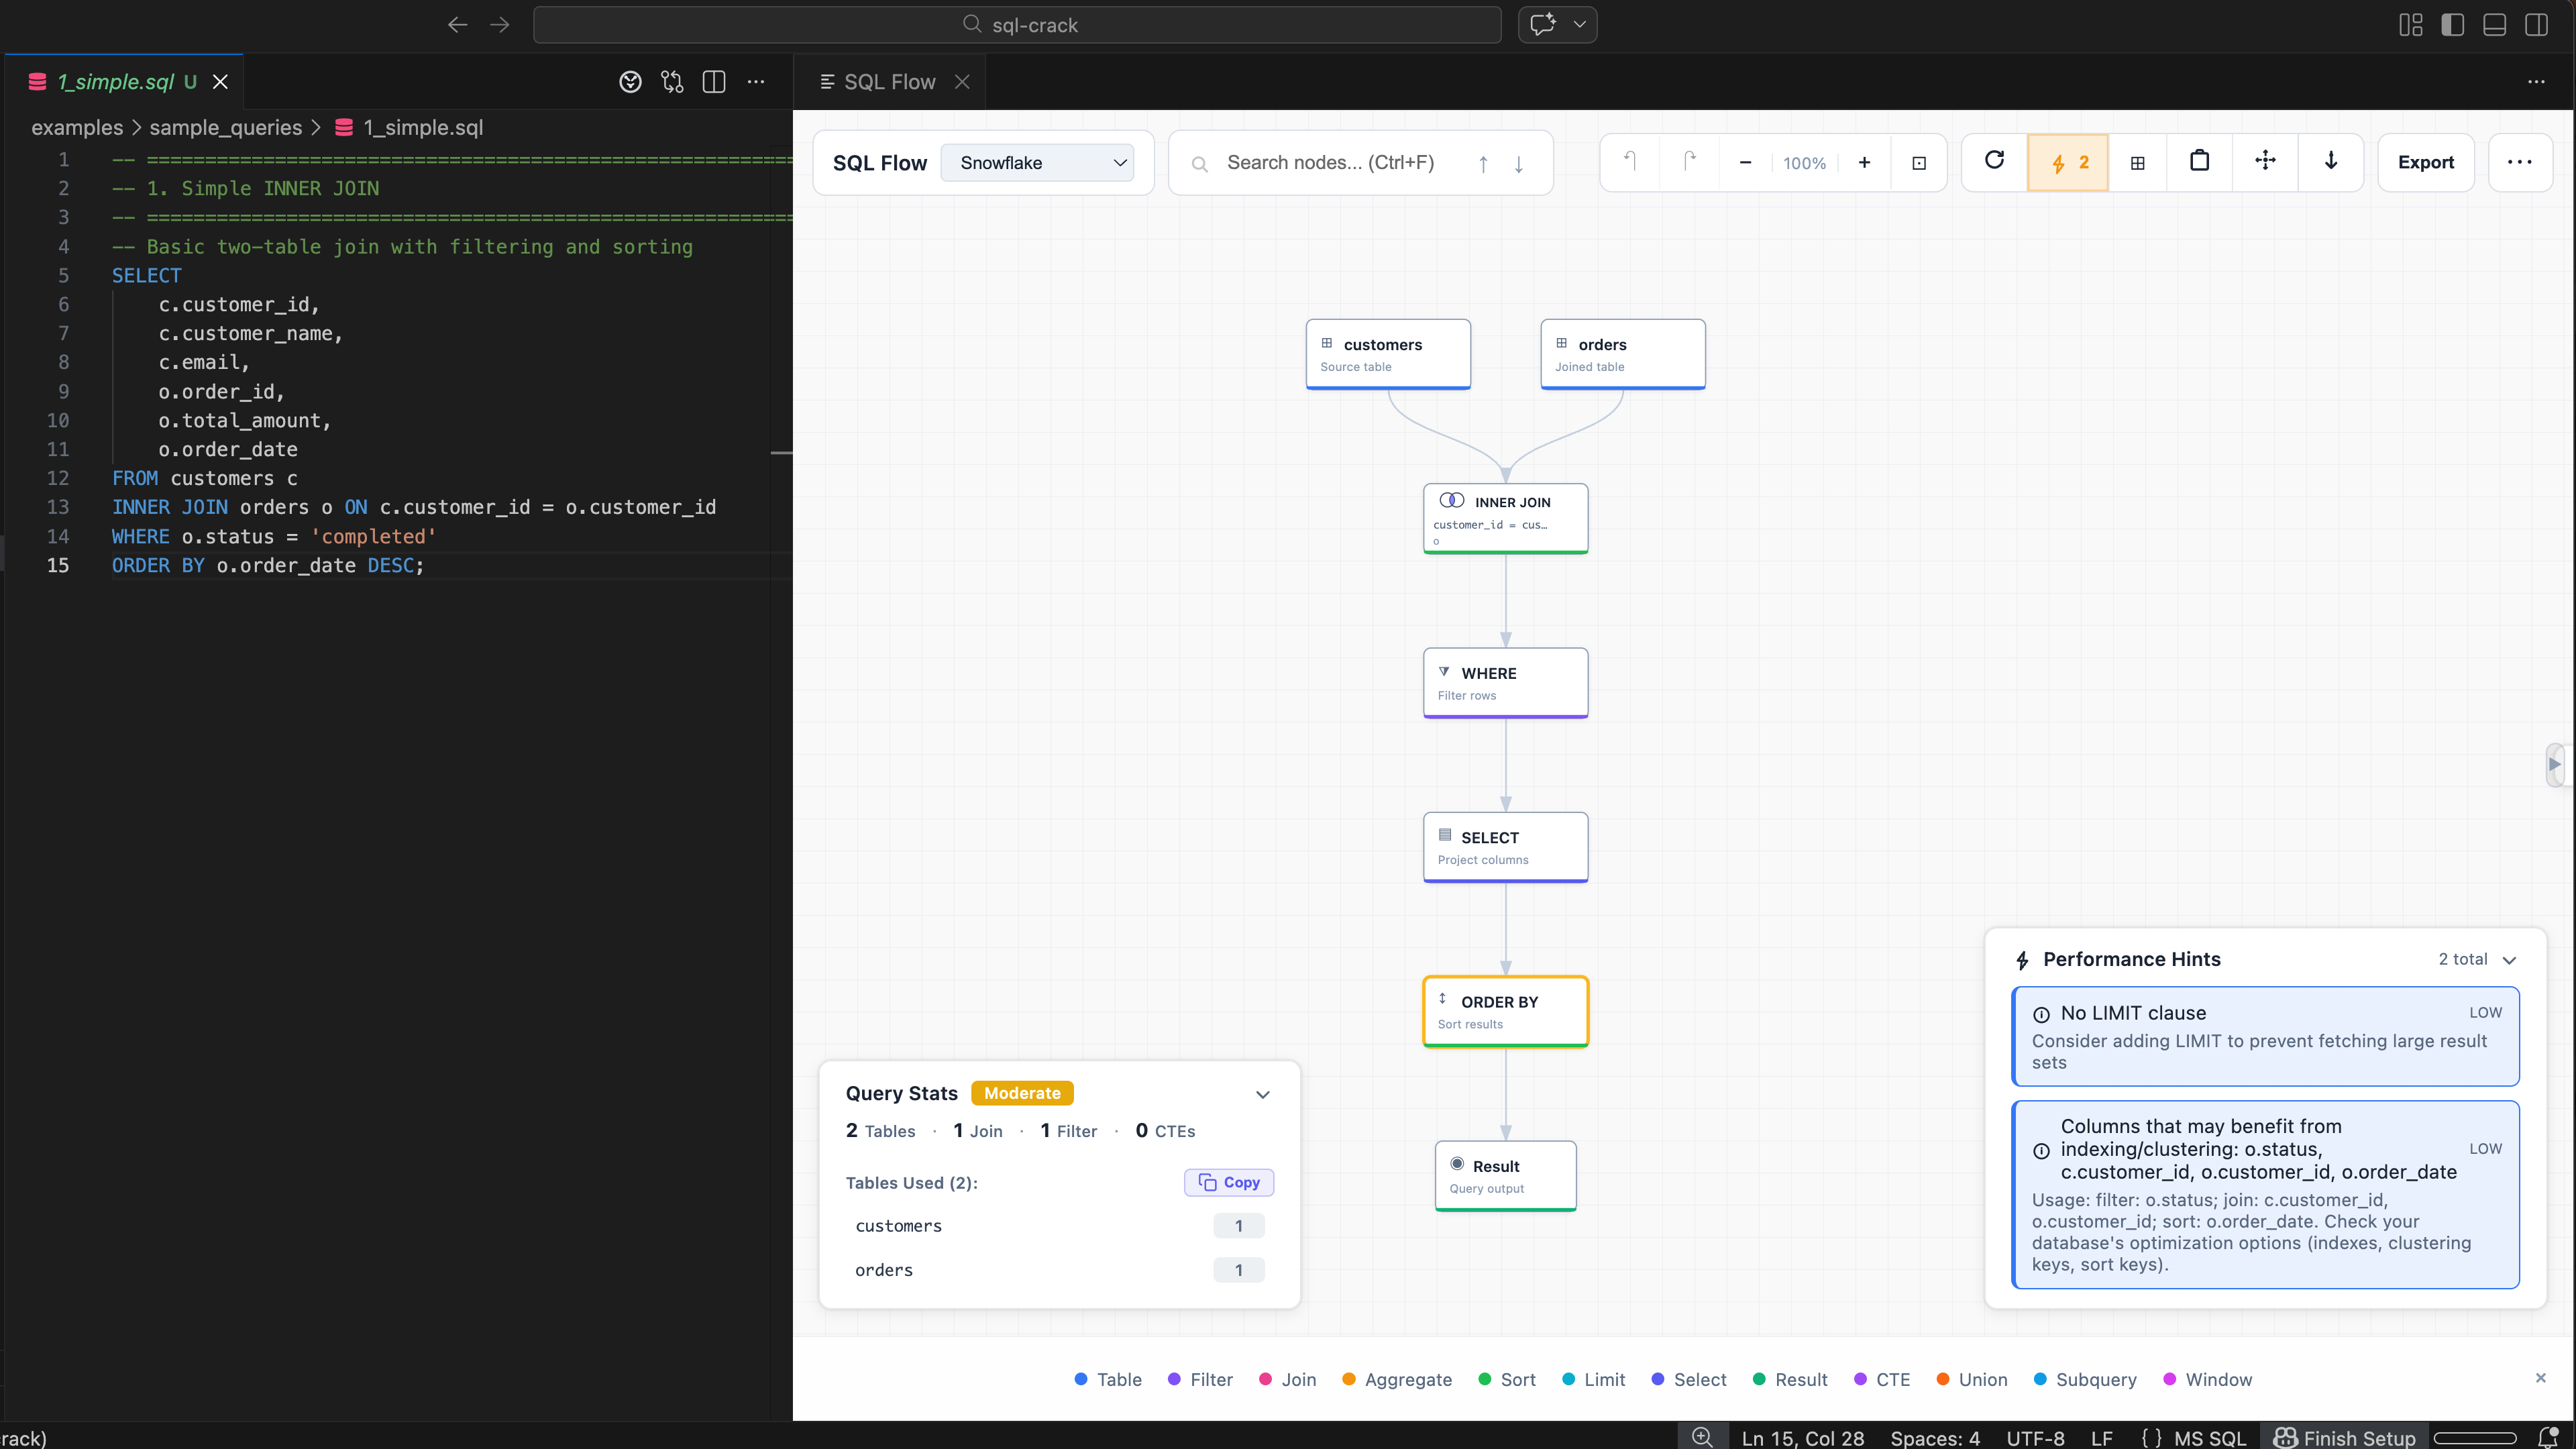
Paste a query and instantly see the data flow — tables, joins, filters, and output stages.
Understand complex SQL at a glance. Visualize execution flow, trace data lineage, and optimize queries with professional-grade visual analysis.
Everything you need to understand, optimize, and document your SQL queries.
See exactly how your SQL executes, step-by-step. Color-coded nodes show tables, joins, filters, aggregations, and more.
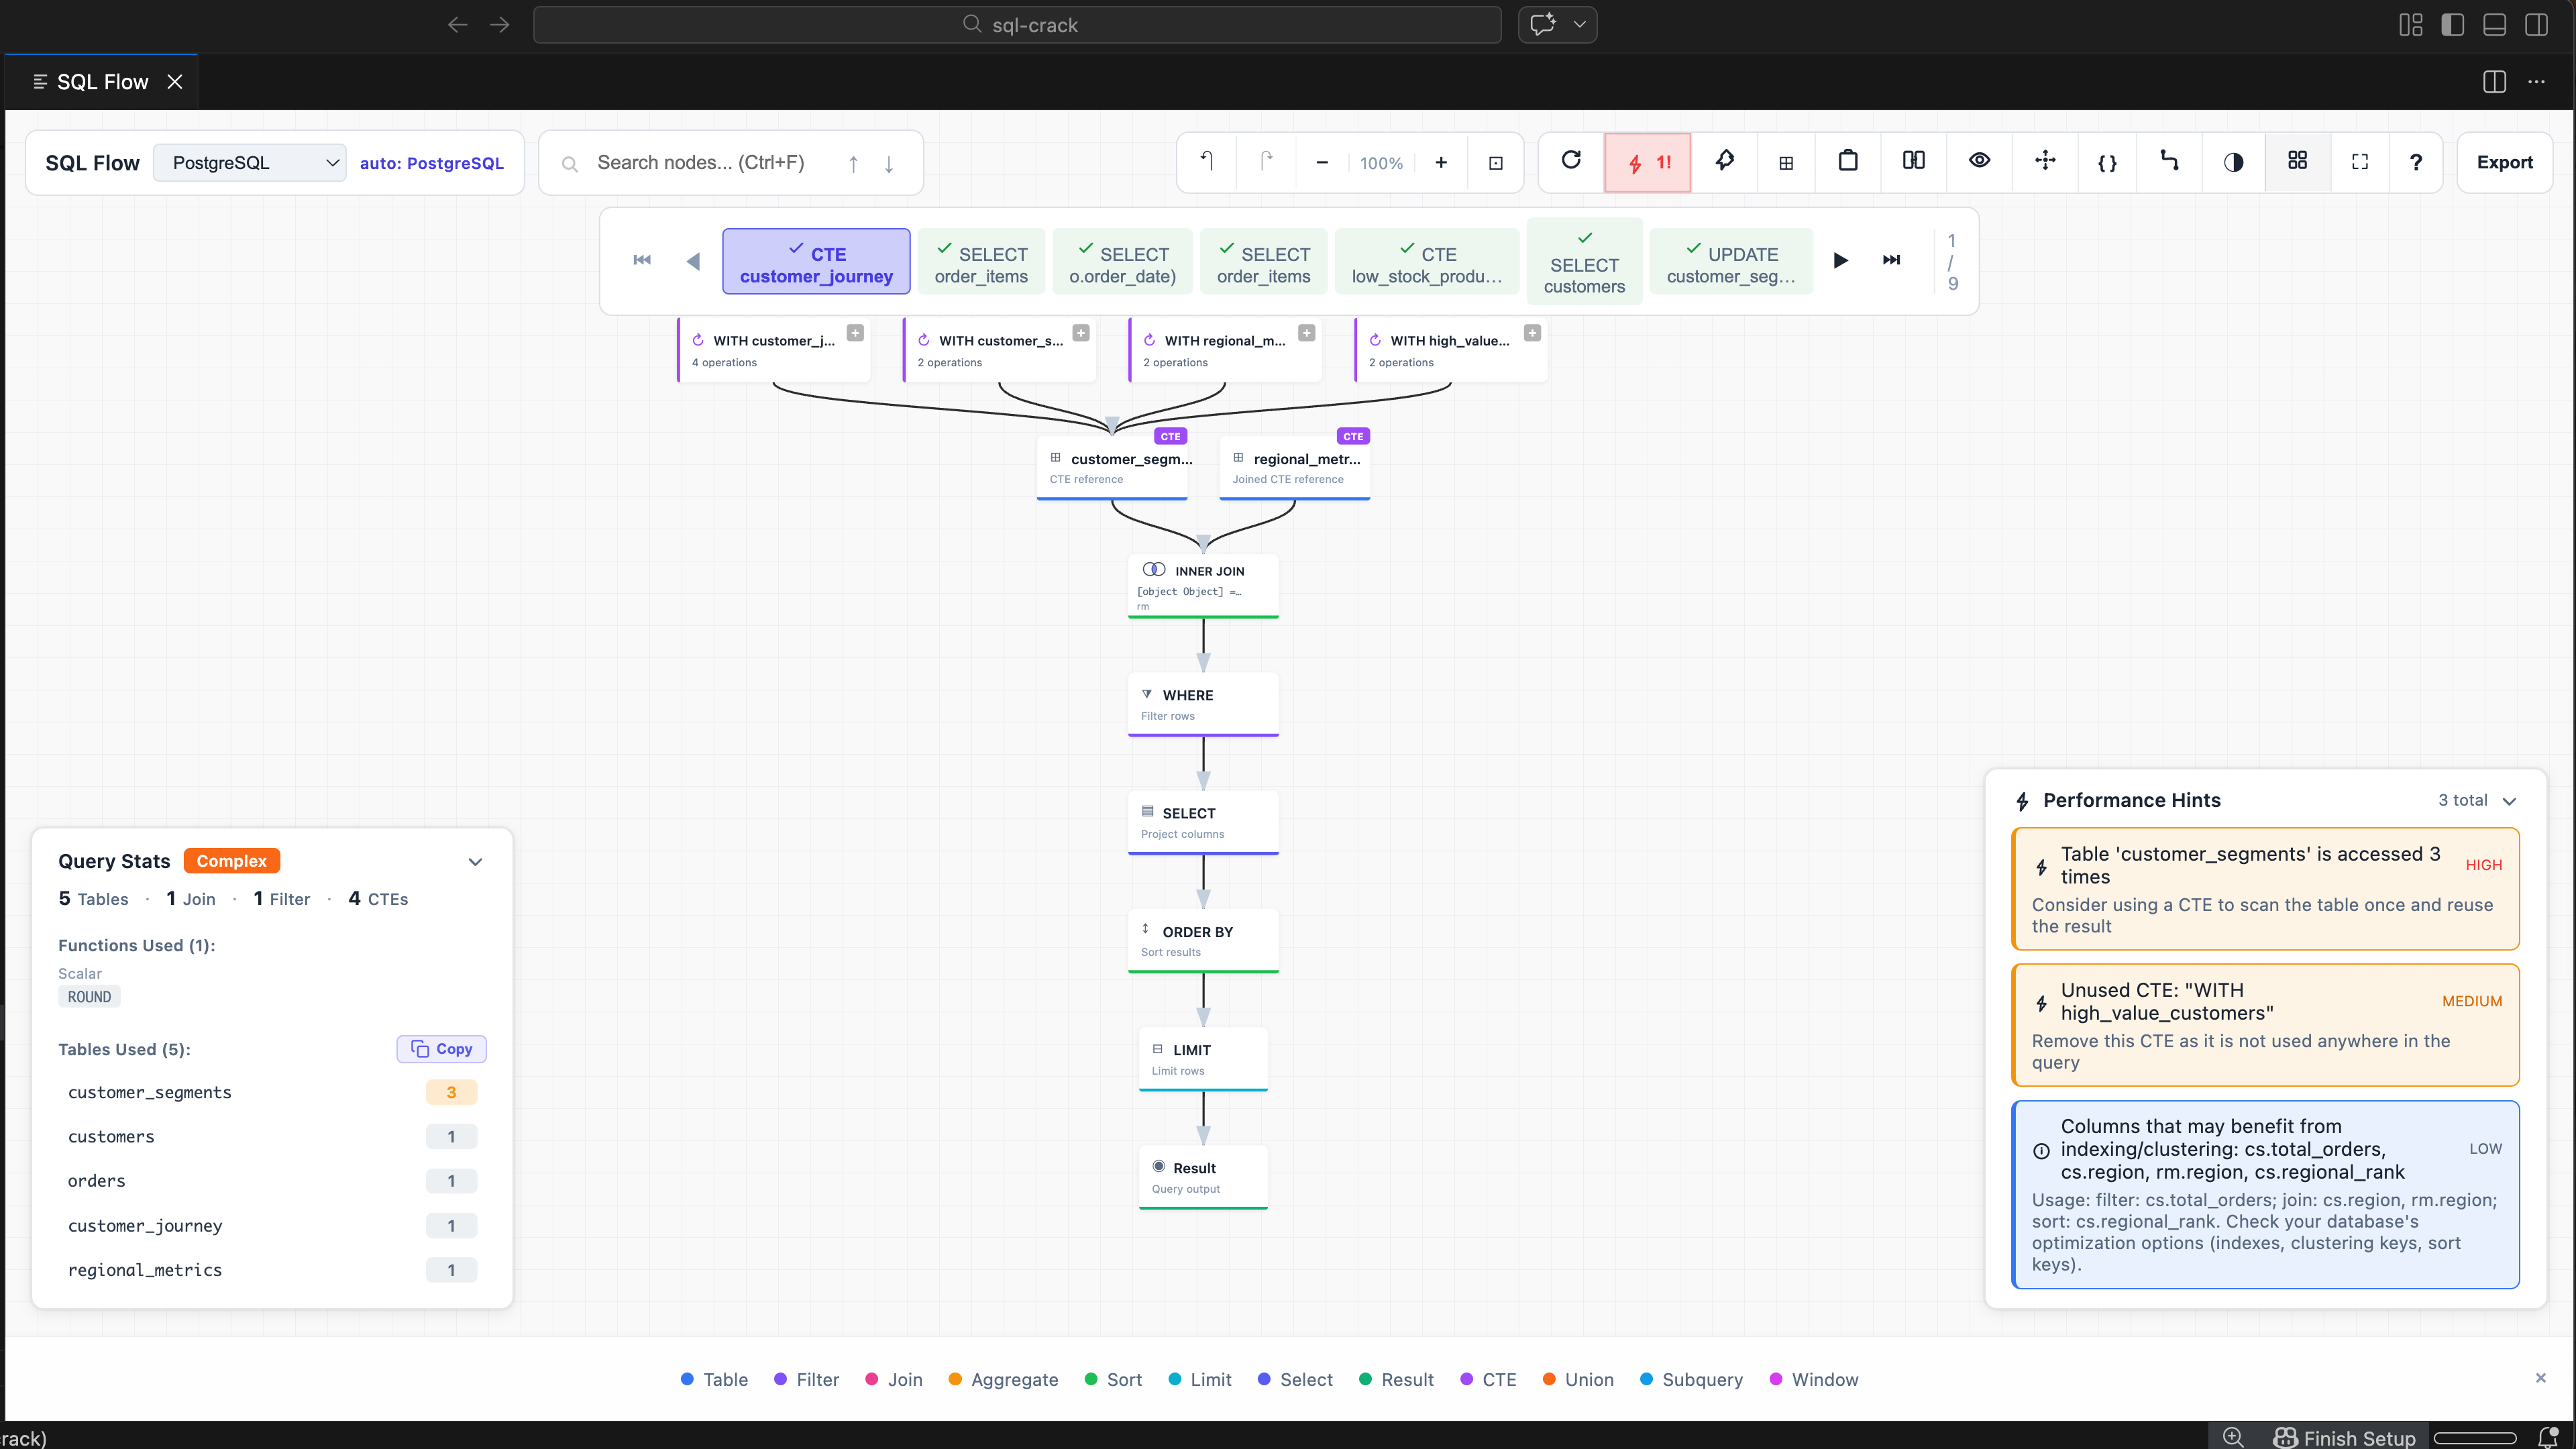
Working with multiple queries? SQL Crack automatically separates and visualizes each statement with intuitive tab navigation.
Click any output column to see its complete transformation path through JOINs, aggregations, and calculations.
Focus on upstream or downstream dependencies from any node. Use search highlighting, minimap navigation, and fullscreen mode to explore large graphs.
Get instant feedback on query quality with performance scoring (0-100), anti-pattern detection, and actionable hints.
Full support for MySQL, PostgreSQL, SQL Server, Snowflake, BigQuery, Redshift, and more. Switch dialects with one click.
From simple joins to complex multi-CTE queries — visualize, analyze, and optimize your SQL.
Paste a query and instantly see the data flow — tables, joins, filters, and output stages.
Handle real-world SQL with CTEs, subqueries, and multi-table joins across 13 dialects.
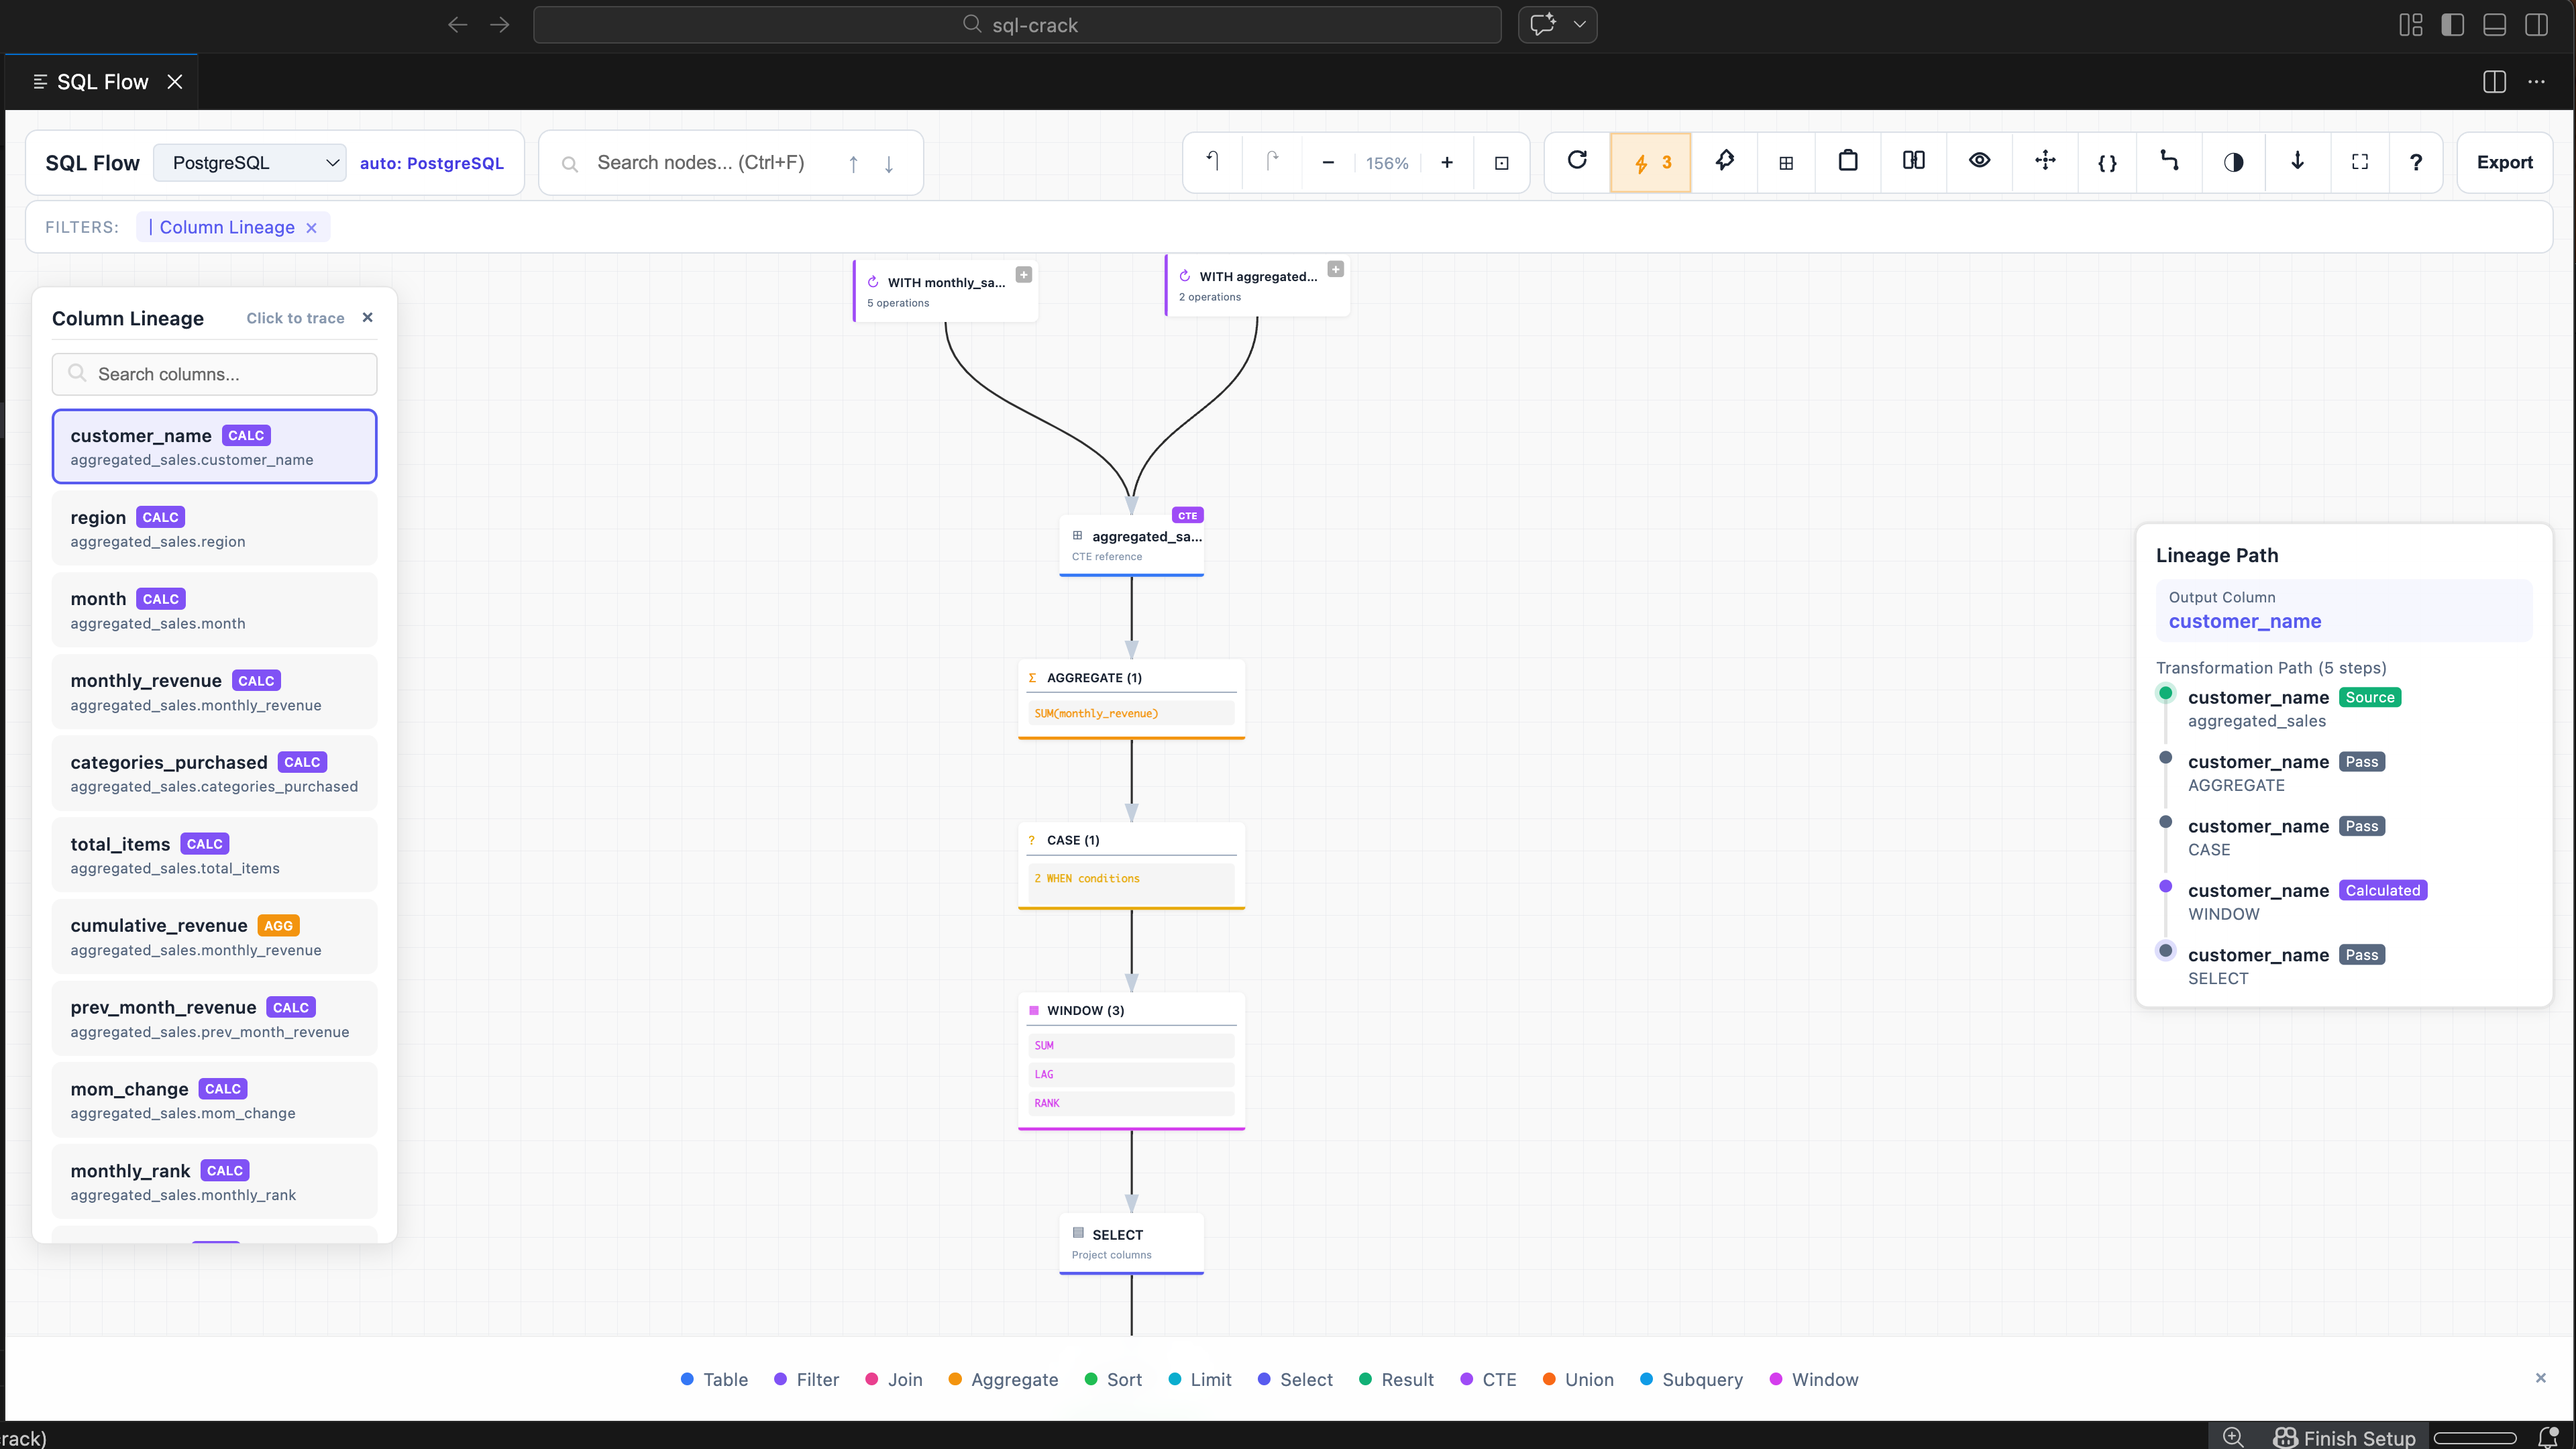
Trace each output column back to its source tables and transformations.
Get optimization suggestions — missing indexes, SELECT *, duplicate subqueries, and more.
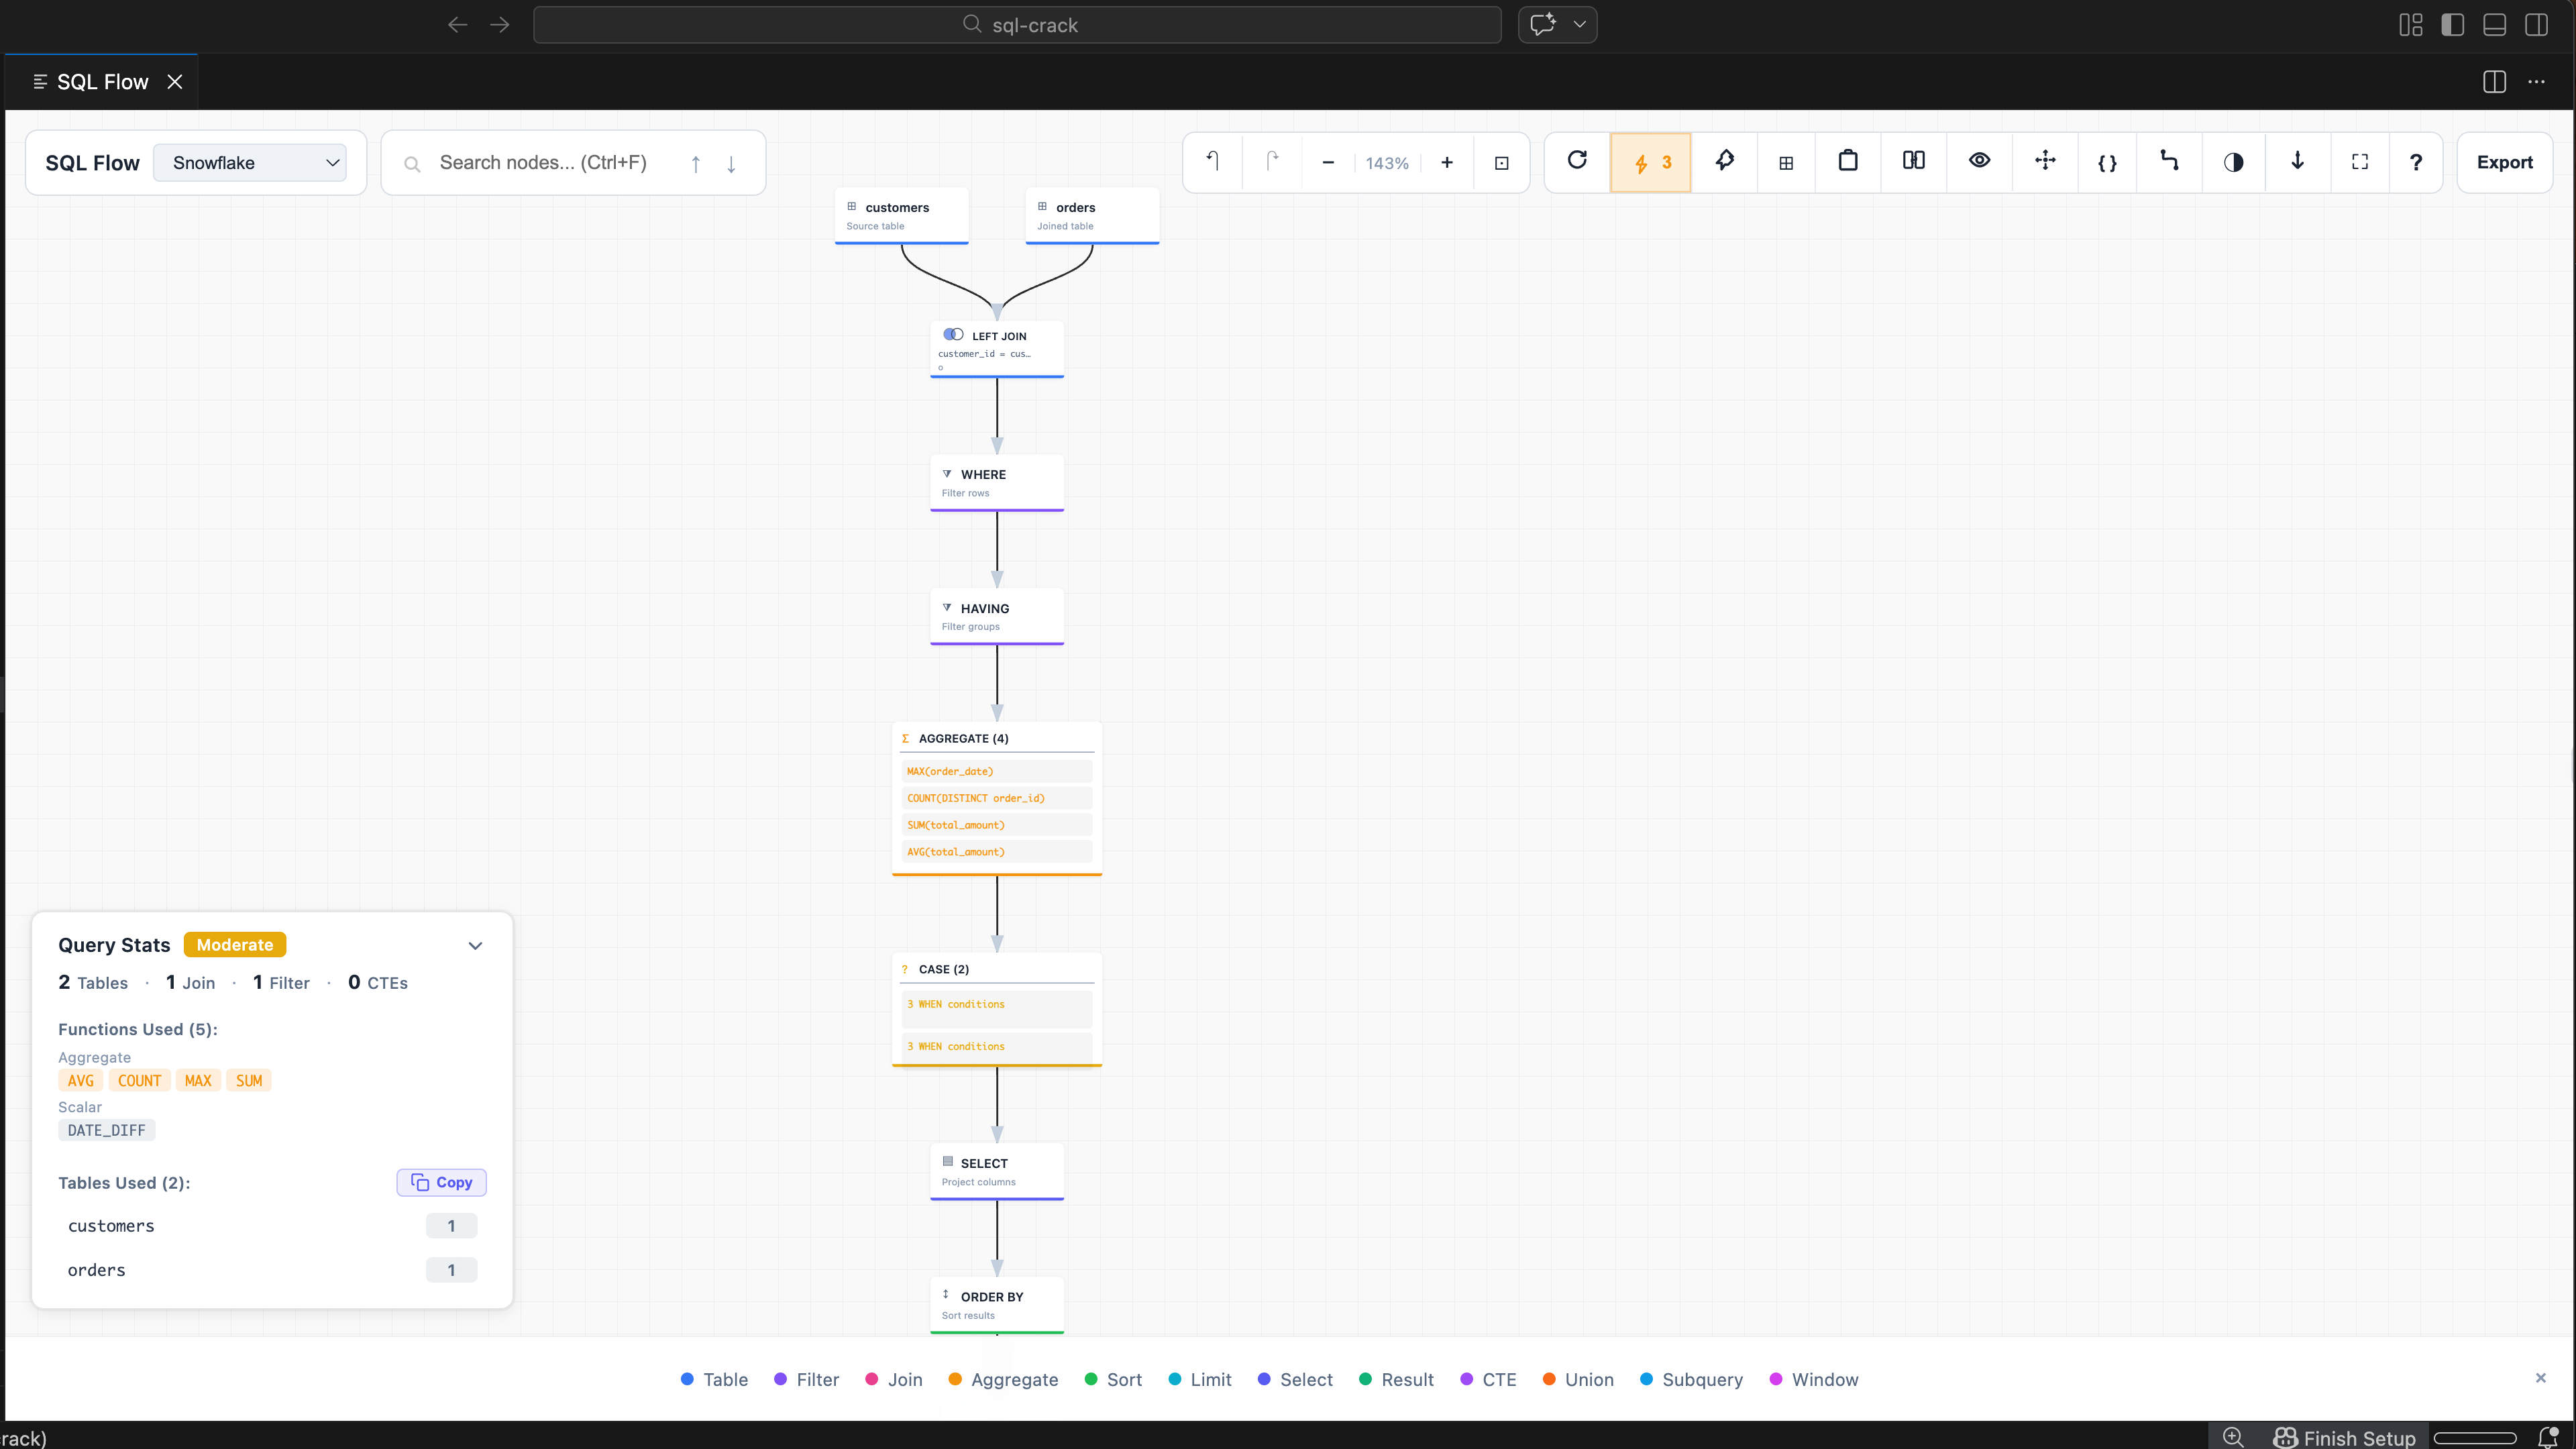
Table usage breakdown, function tracking, and complexity scoring at a glance.
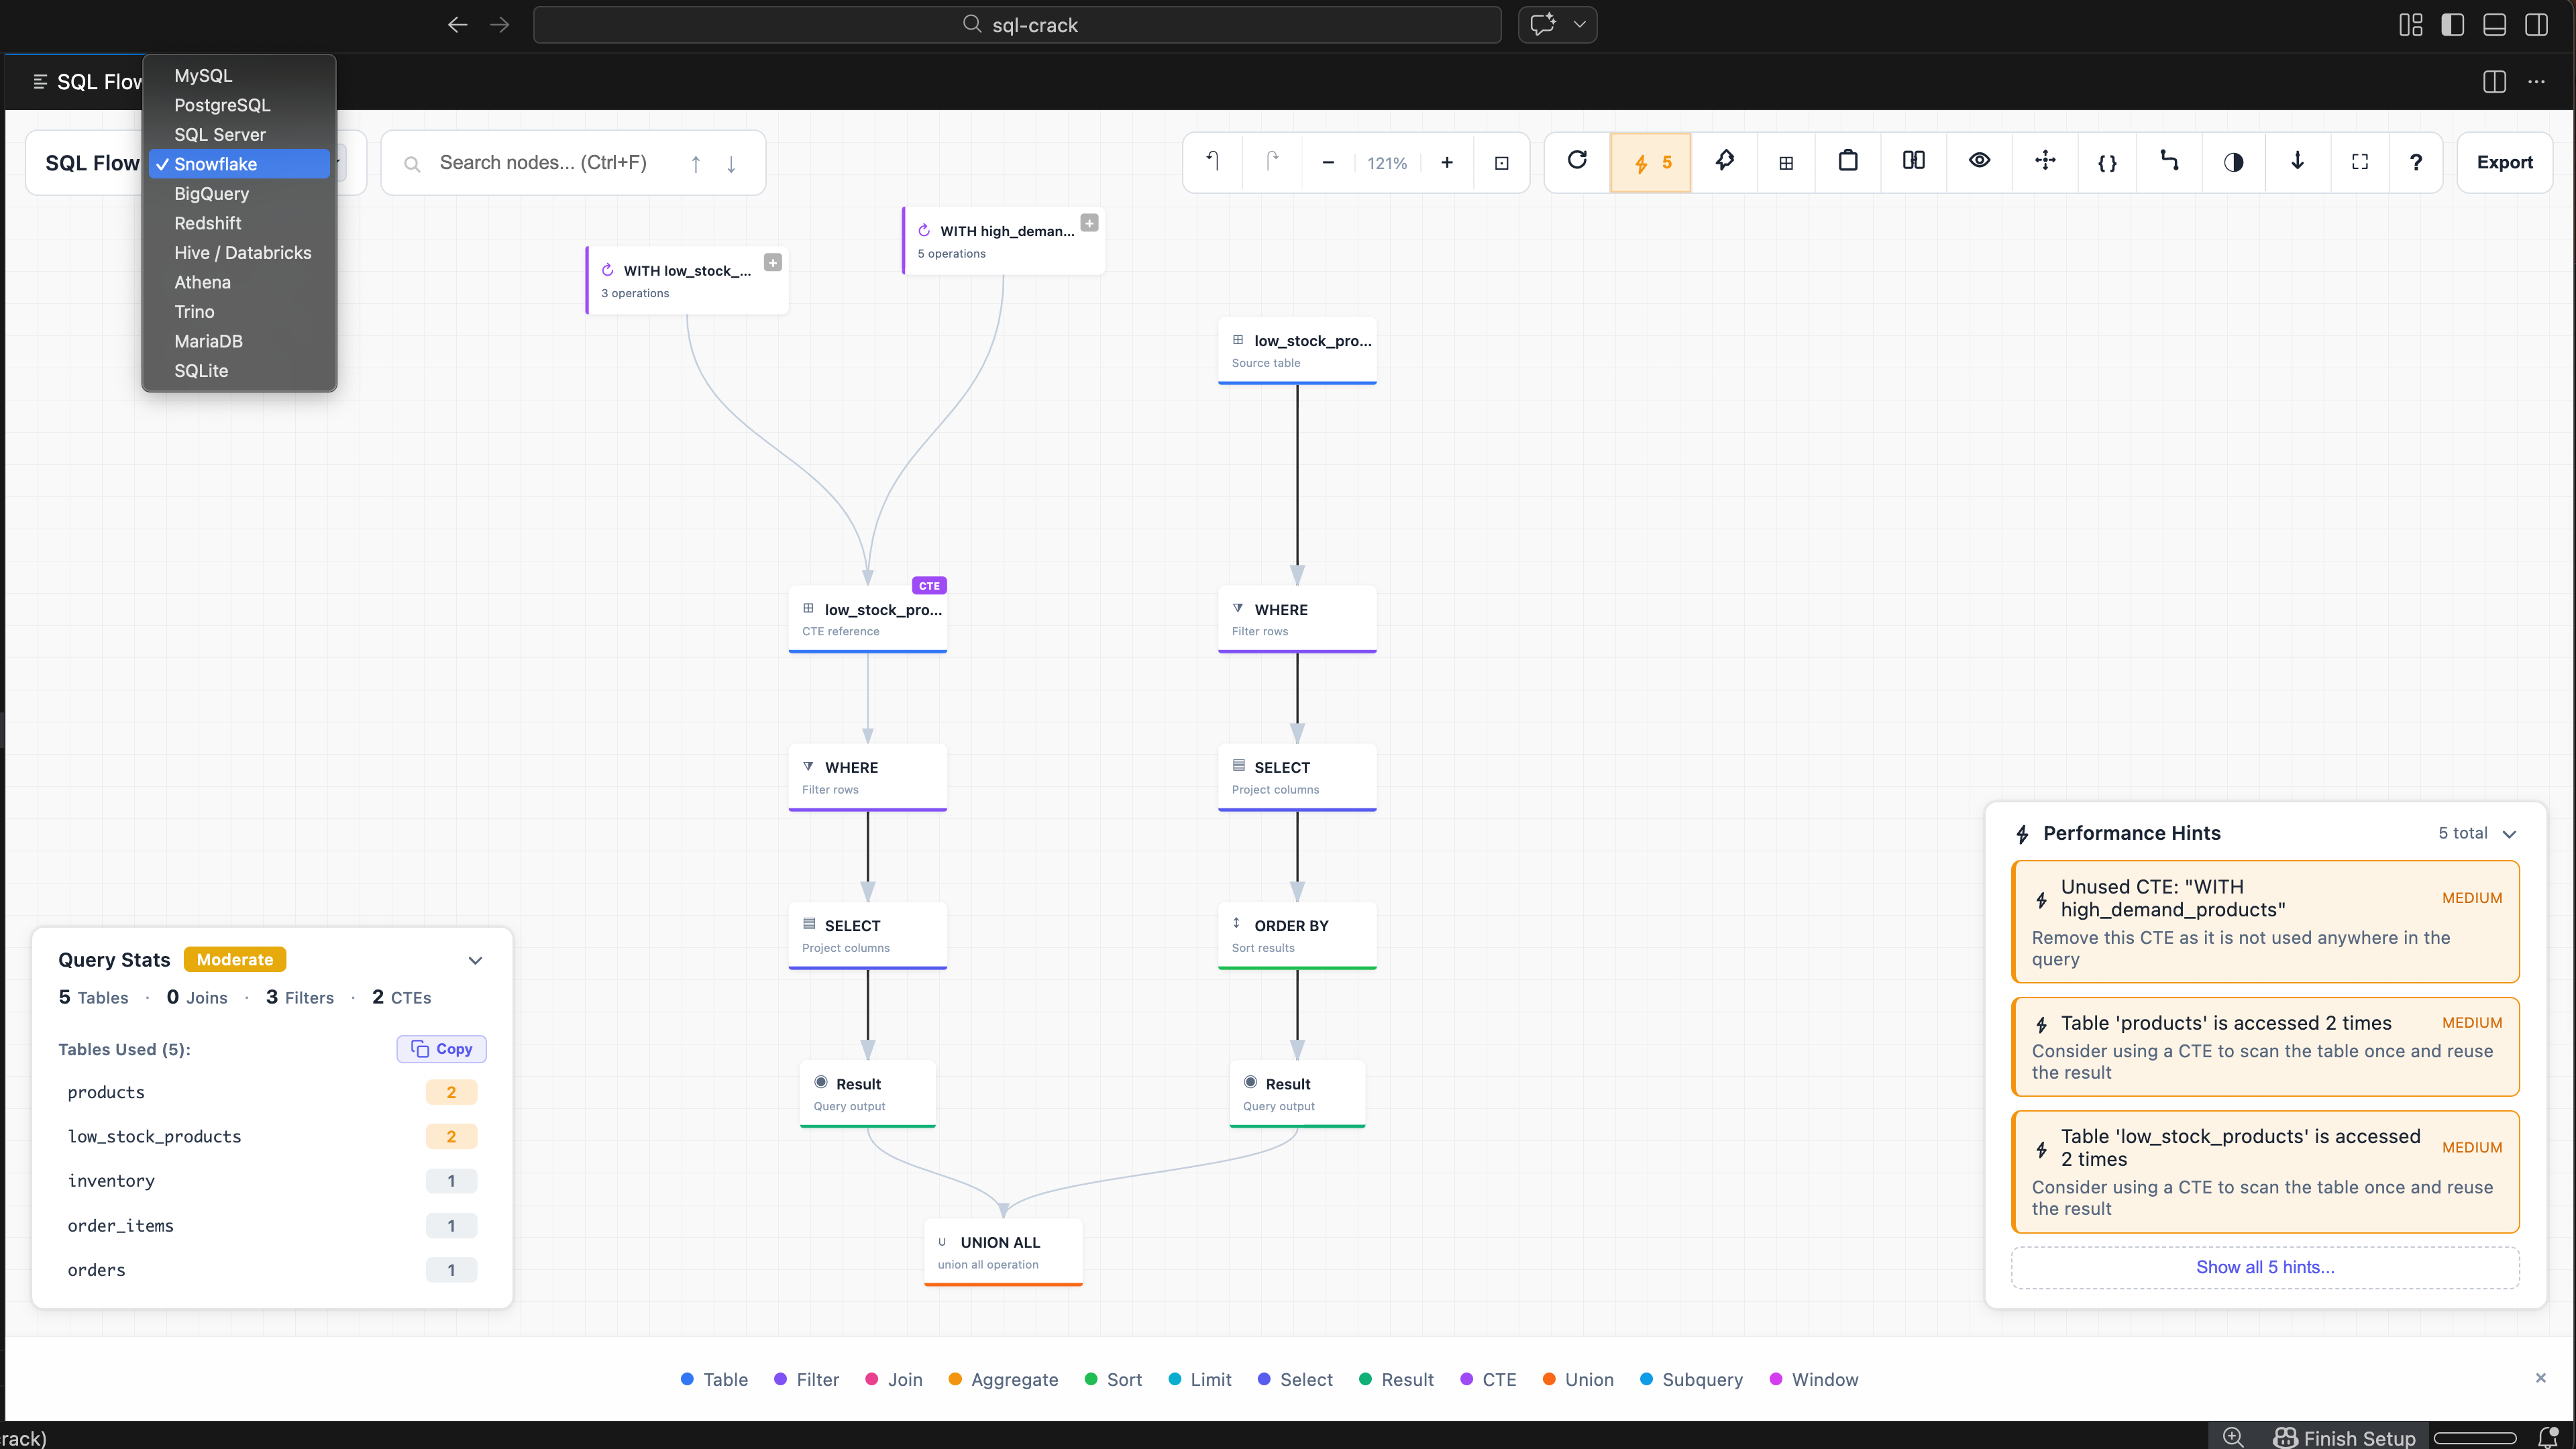
13 SQL dialects — MySQL, PostgreSQL, Snowflake, BigQuery, SQL Server, and more.
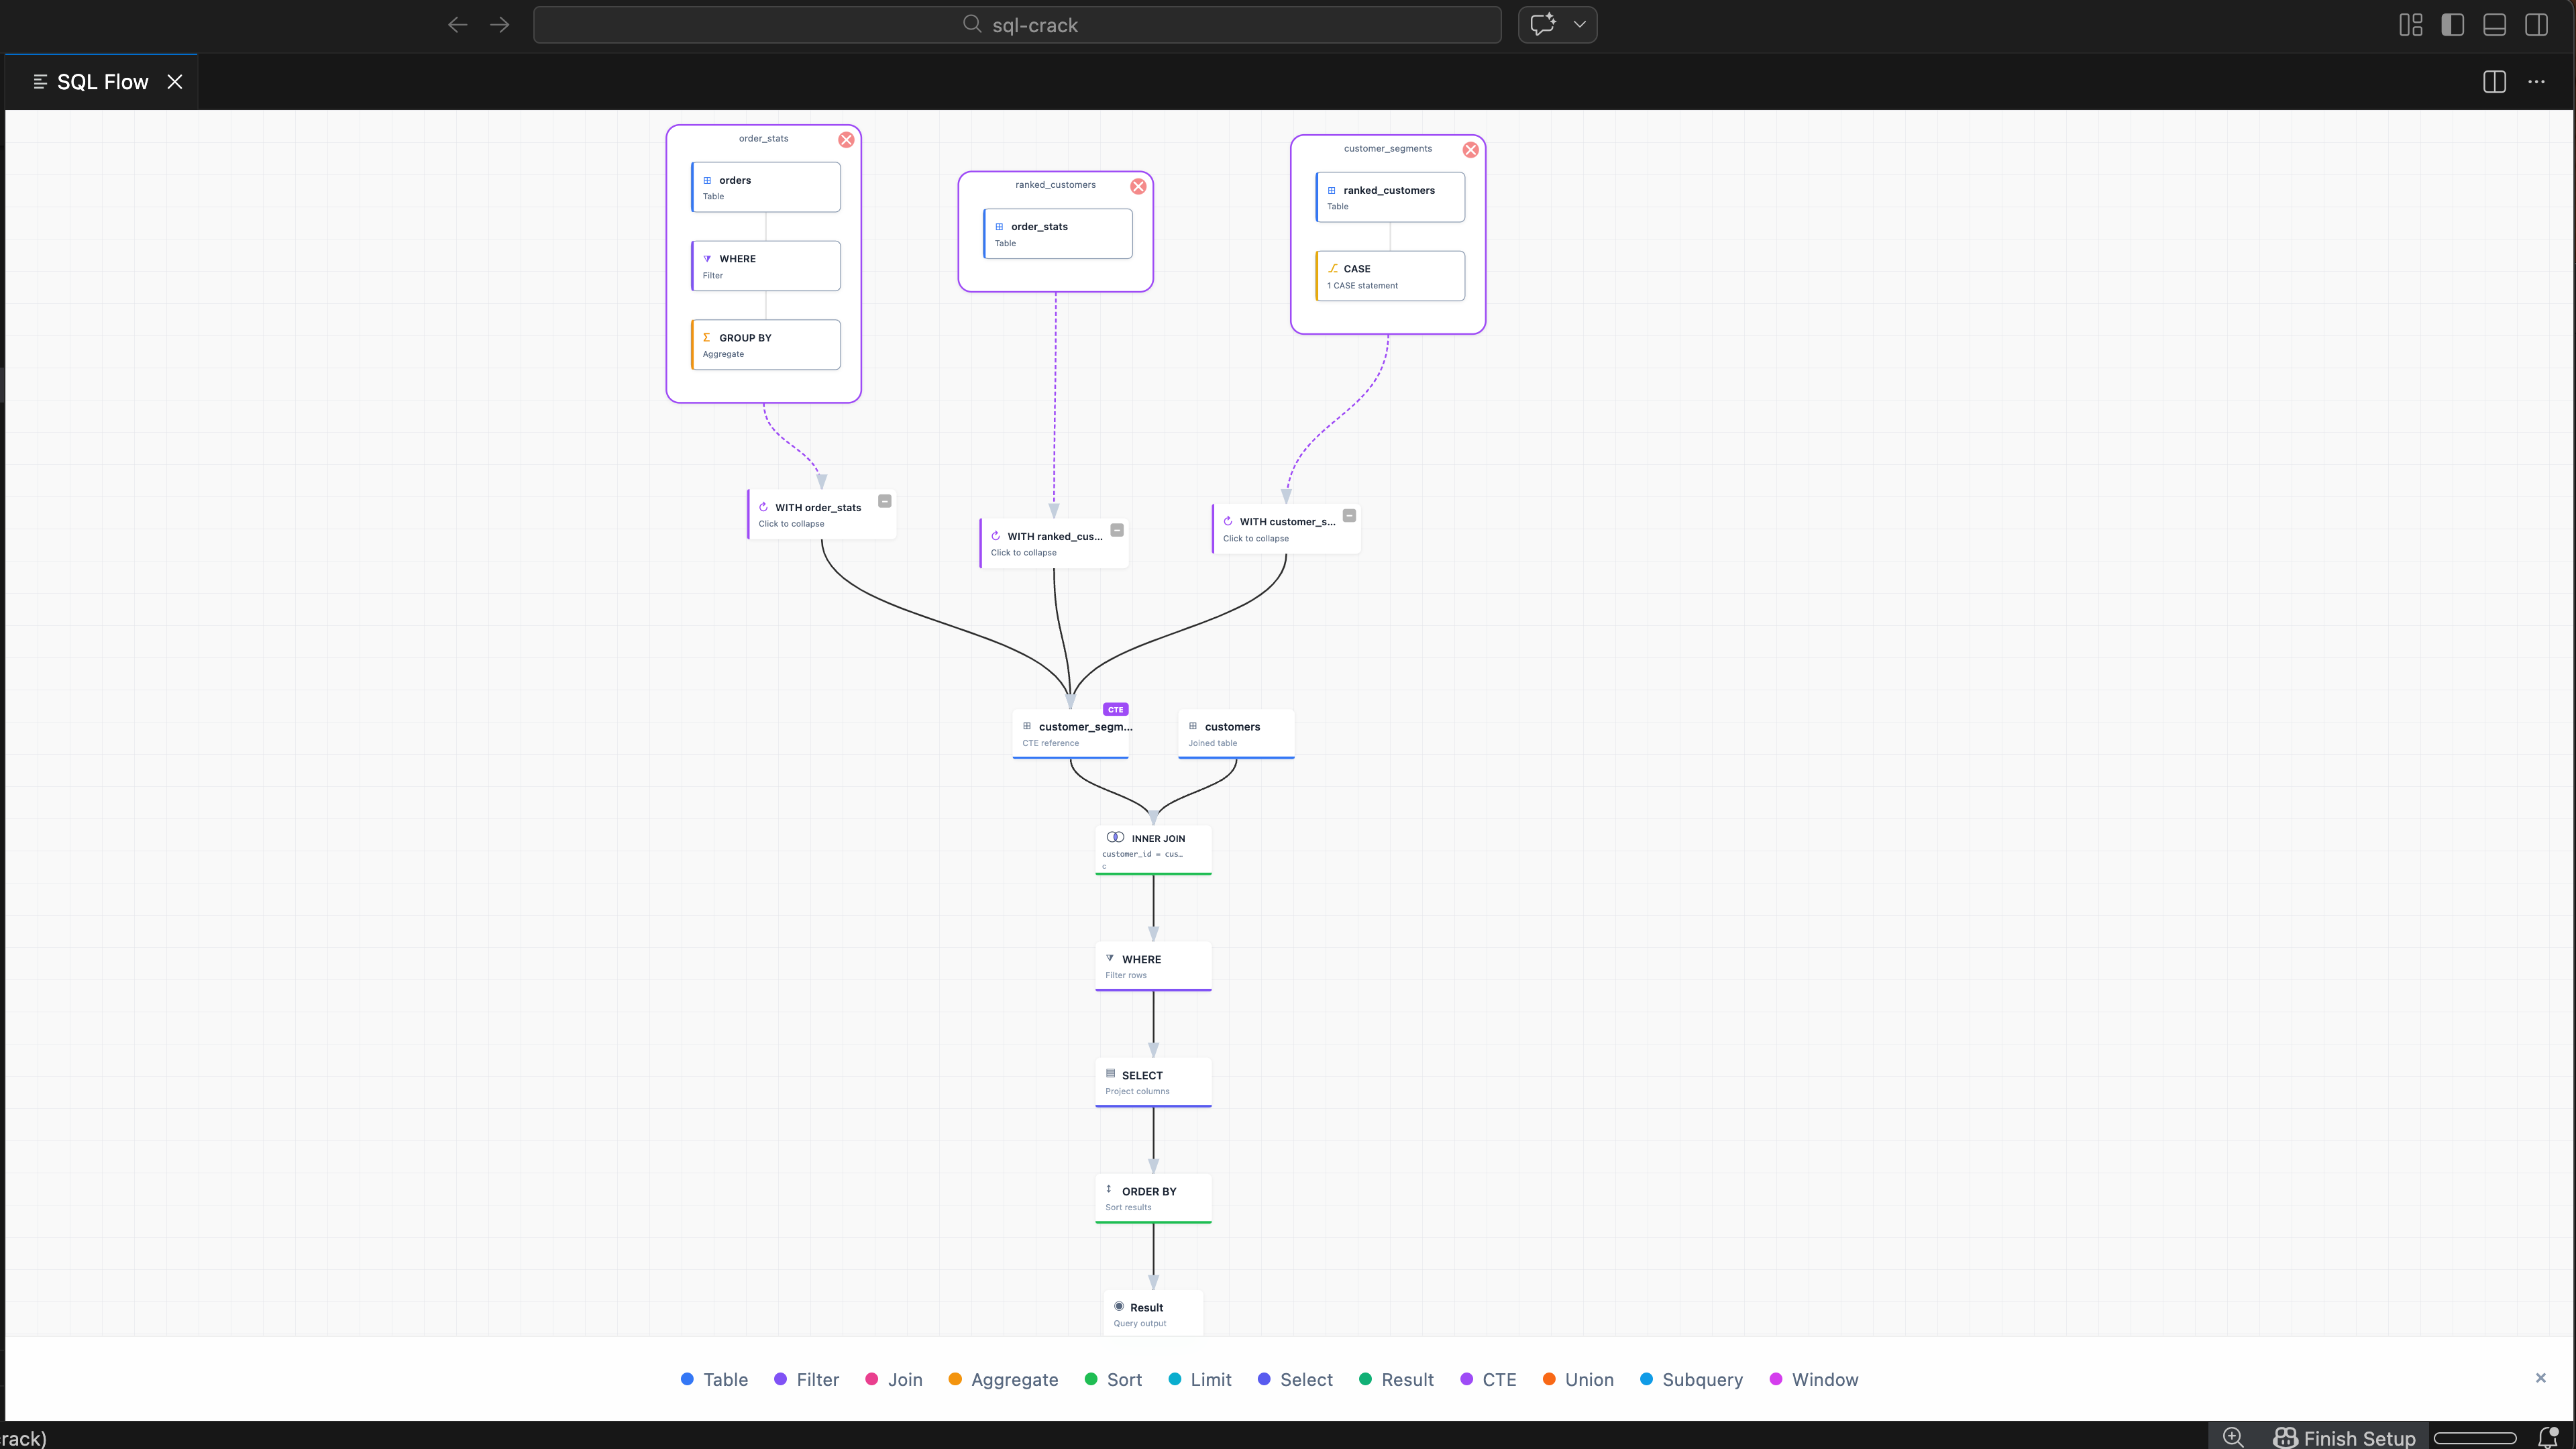
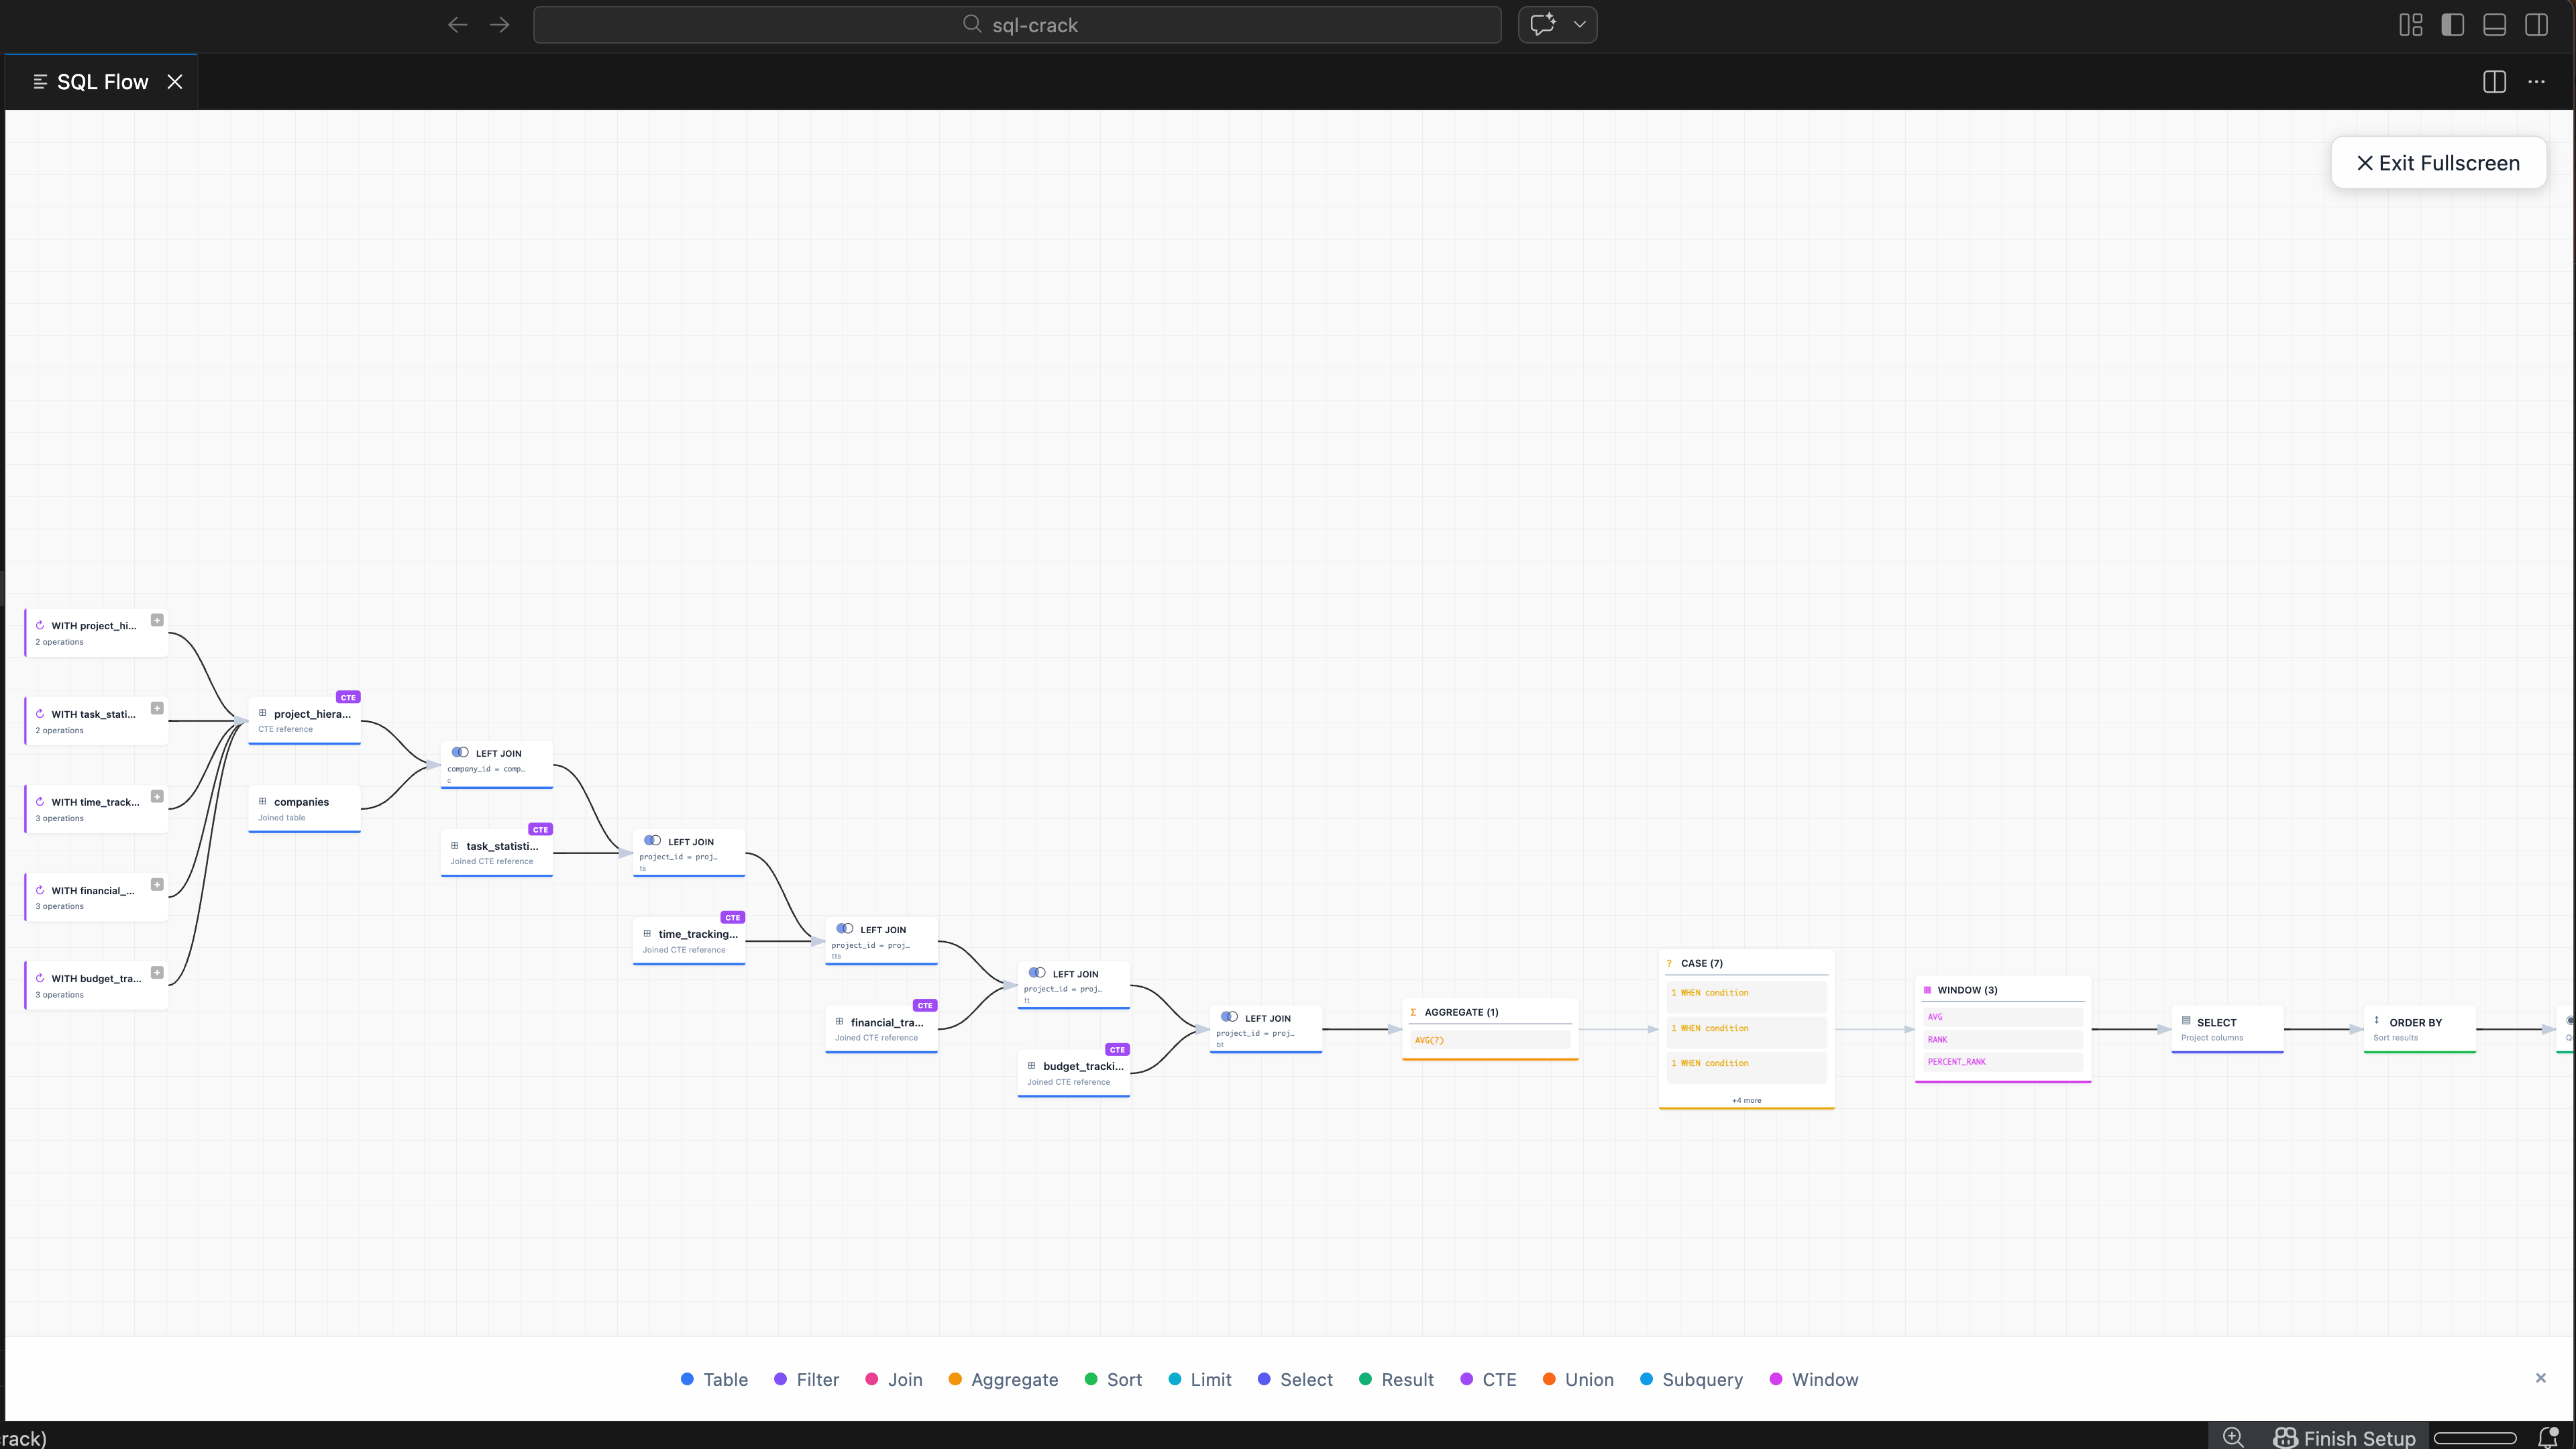
Expand CTEs to see inner operations — tables, filters, and aggregations inside each CTE.
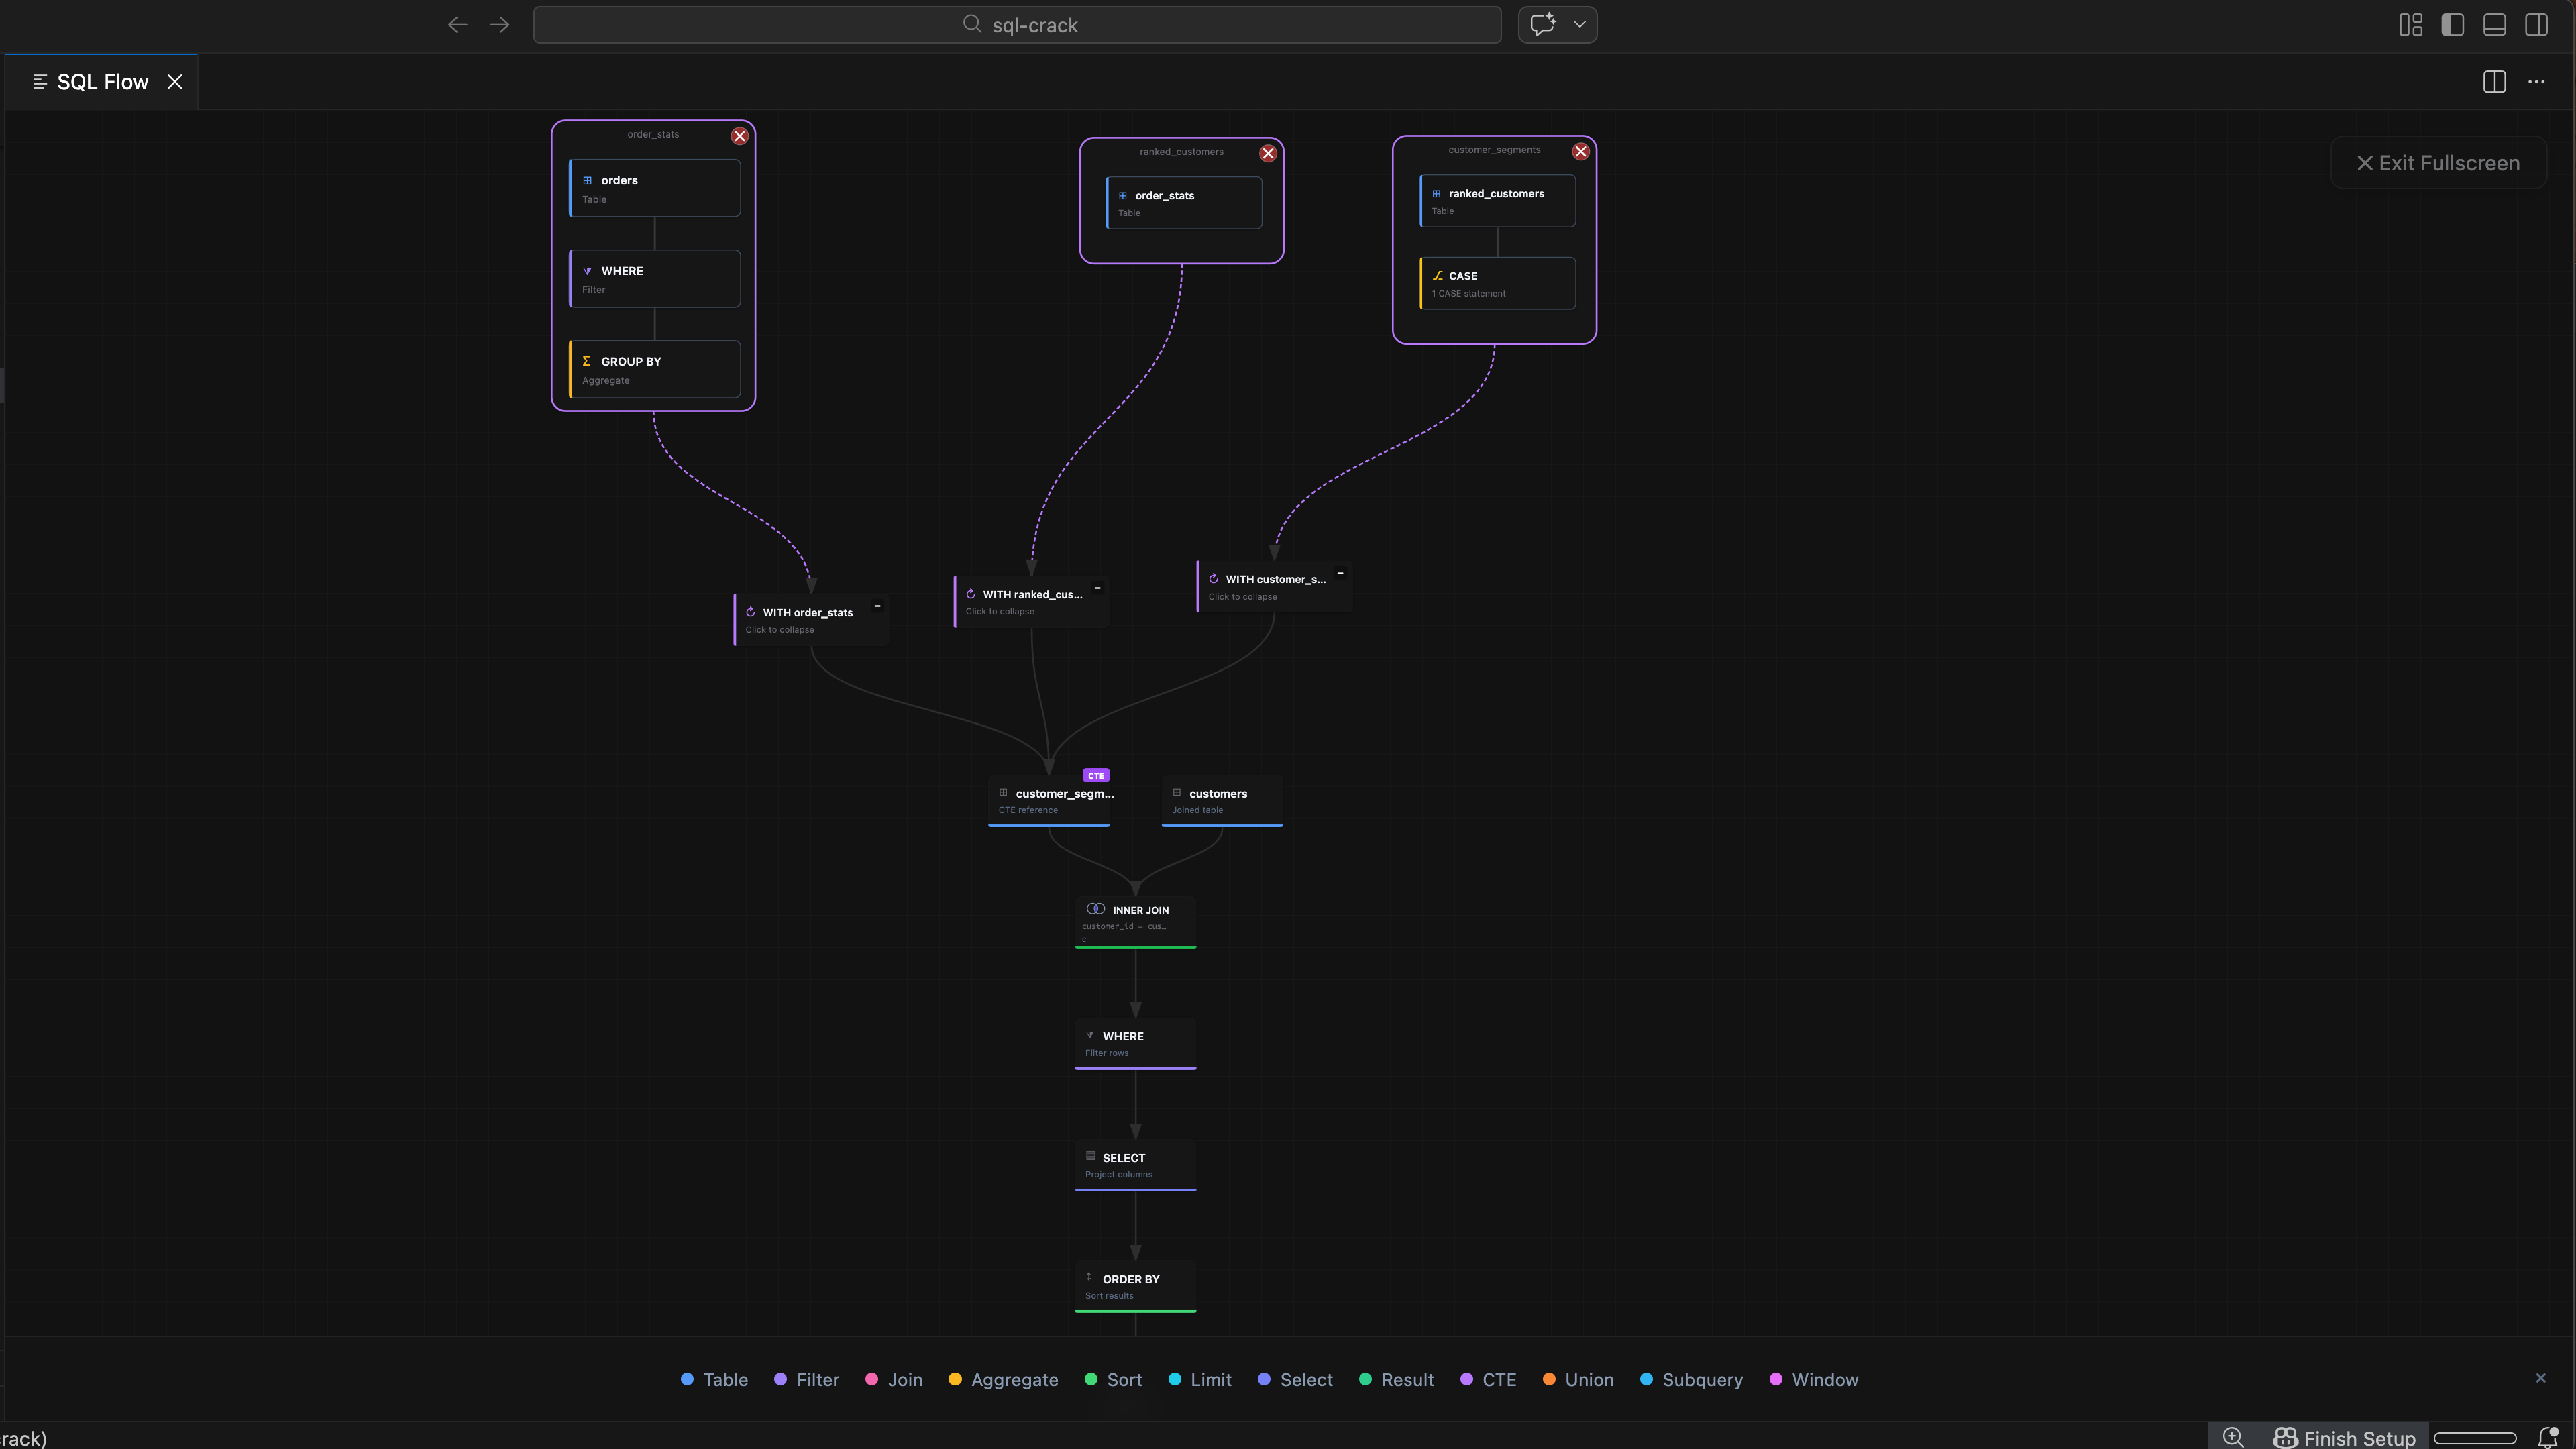
Fullscreen mode with expanded CTE clouds in dark theme for distraction-free analysis.
Explore sample queries here, then open the full playground for your own SQL.
SELECT
    c.customer_id,
    c.customer_name,
    o.order_id,
    o.order_date,
    p.product_name,
    oi.quantity,
    oi.unit_price,
    oi.quantity * oi.unit_price AS line_total
FROM customers c
INNER JOIN orders o ON c.customer_id = o.customer_id
INNER JOIN order_items oi ON o.order_id = oi.order_id
INNER JOIN products p ON oi.product_id = p.product_id
WHERE o.status = 'completed'
    AND o.order_date >= '2024-01-01'
ORDER BY o.order_date DESC
SQL Crack supports all major SQL dialects, so you can visualize queries from any database platform.
13 dialects supported — missing yours? Request it on GitHub
Start with the web version for quick visualization, or install the VS Code extension for the full workflow.
Perfect for quick visualization
For professional workflows
We believe developer tools should respect your data. SQL Crack was built with privacy as a core principle.
All processing happens locally in your browser or VS Code. Nothing is sent to any server.
We do not collect, transmit, or store your SQL statements. Query parsing and flow generation run locally.
MIT licensed. Inspect the code yourself. Verify our privacy claims. Contribute improvements.
Quick answers to common questions about SQL Crack.
Yes. Open /playground, paste your query, and click Visualize. Parsing happens entirely in your browser and your SQL is not sent to a backend.
No. The web demo parses SQL entirely in your browser, and the VS Code extension processes queries locally. Your SQL text is not uploaded or stored.
MySQL, PostgreSQL, SQL Server, MariaDB, SQLite, Snowflake, BigQuery, Redshift, Hive, Athena, Trino, Oracle, and Teradata.
Yes. The extension and website are free and open-source under the MIT license.
Yes. SQL Crack is available on OpenVSX (https://open-vsx.org/extension/buvan/sql-crack) and works in any editor that supports VS Code extensions.
The website playground lets you try SQL Flow without installing anything. The VS Code extension adds right-click visualization, multi-file workspace dependencies, and full dialect support. See the comparison table on the homepage for details.
Yes. Both the web playground and the extension support multi-statement SQL. Paste multiple queries separated by semicolons — each gets its own tab. The extension also analyzes dependencies across multiple files in a workspace.
SQL Crack visualizes DML statements (SELECT, INSERT, UPDATE, DELETE) and shows DDL definitions like CREATE TABLE as schema blocks. The focus is on data flow — how queries read, transform, and write data.
Not currently. SQL Crack visualizes declarative SQL — data flow, not control flow. Stored procedures require dialect-specific procedural parsers, which is a fundamentally different problem.
The web playground now uses the same full parser engine as the VS Code extension. If a query fails, it falls back to a simpler parser and then to pattern matching. Try selecting the correct dialect first. If parsing still fails, open an issue with the SQL sample.
Most queries visualize instantly. Very large queries with many CTEs, deep nesting, or hundreds of columns may be slower in the browser due to memory and CPU limits. The VS Code extension handles large queries more efficiently.
First, confirm you selected the correct dialect. Then try isolating the minimal SQL that produces the wrong result. If the web demo is wrong but the extension is correct, the web parser may not support that pattern yet. If both are wrong, open an issue with the SQL sample, selected dialect, and expected vs actual output.
Yes. Export the flow diagram as PNG, SVG, Mermaid, or DOT (Graphviz) format. Export buttons are in the toolbar above the visualization panel. Use PNG for sharing, SVG for presentations, Mermaid for documentation, and DOT for Graphviz or draw.io.
Open an issue at https://github.com/buva7687/sql-crack/issues with the SQL sample, selected dialect, and expected vs actual output. The more minimal the example, the faster the fix.
On GitHub: https://github.com/buva7687/sql-crack
Join developers using SQL Crack to understand, optimize, and document their SQL queries.